


Featured
149 Articles Found
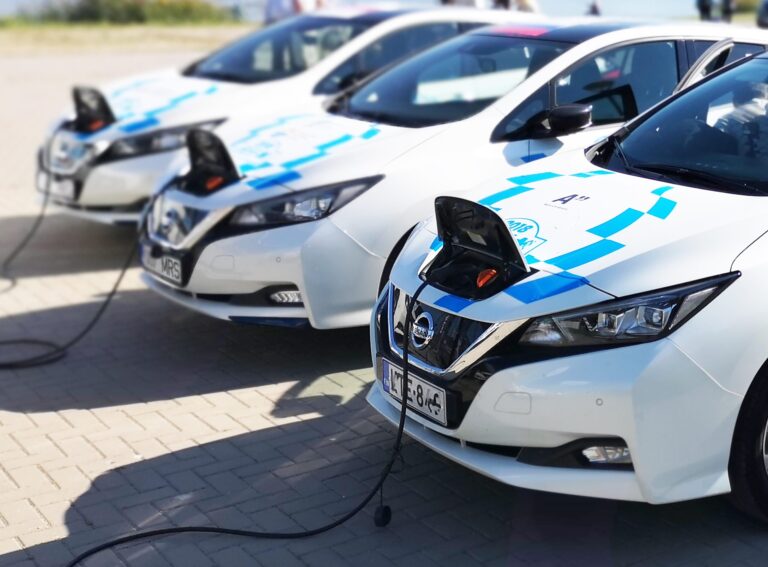
Fleet Electrification: Decoupling Your Fleet from Fuel Price Exposure

From Coordination to Orchestration (Pt 3): Process vs ecosystem problems and resolving systemic blockers
From Coordination to Orchestration (Pt 2): What orchestration actually does: sequencing, prioritisation and strategic intervention

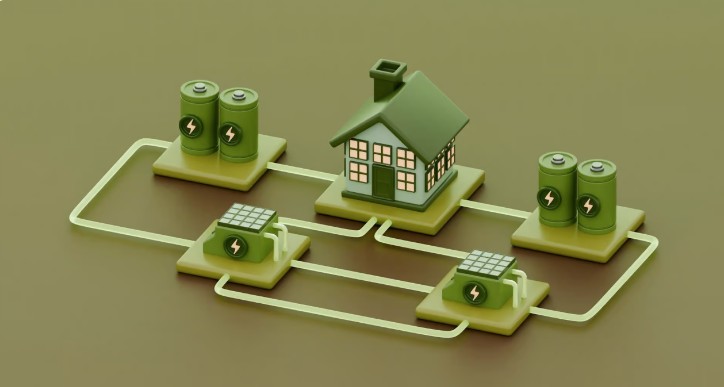
From Coordination to Orchestration (Pt 1): The role of a central orchestrator in delivering the energy transition faster, cheaper, and better
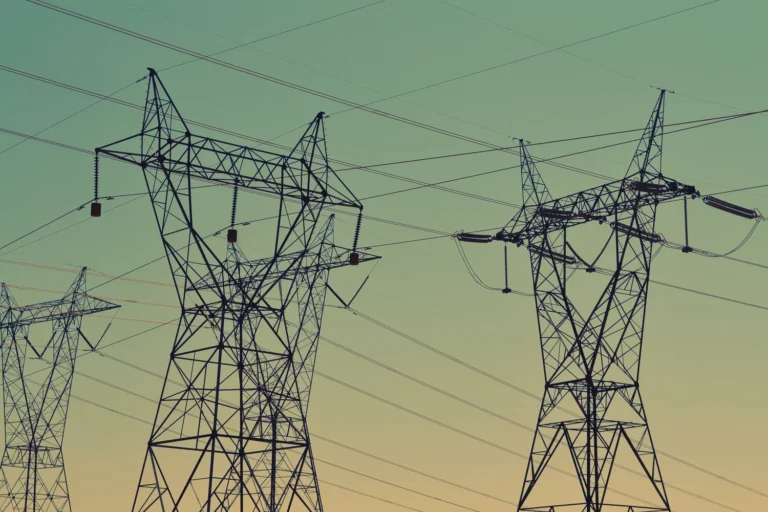
Australia’s Electricity Networks to 2050: Comparative Economic Outlook across all 15 DNSP Regions

Climate Statement Insights

Decarbonisation Modelling and Roadmap
From Strategy to System Operator: Building the Flexible Grid
Considerations for Entry into the Australian Energy Project Development Market

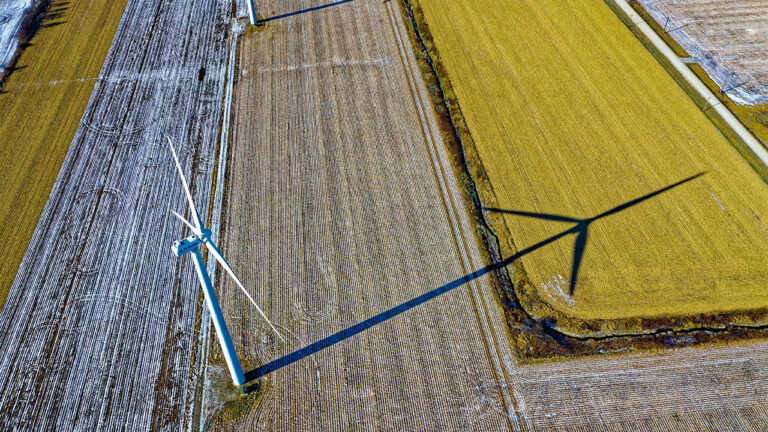
The Renewable Energy Dilemma in Mining: Commercial Models for Procuring Renewables

From Risk to Resilience: Embedding Customer Vulnerability into Utility Strategy and Operations